
Crypto Weekend: Bitcoin Breaks 10-Year Trendline - Can $81k Hold?
$BTC $ETH $IBIT $ETHU $CIFR $IREN $BITF $MSTR

Hello traders,
Hope you’re having a wonderful weekend. Let’s talk about crypto, as every weekened, recap what happened in the last week, and dive into some charts.
1. Bitcoin: The Battle for $90,000
We failed to sustain above 90k and gain momentum to the upside. We broke down the bear flag we have posted for you last week and this has shifted the technical bias to the downside. Please read our last week’s hypothesis and bitcoin price prediction here.
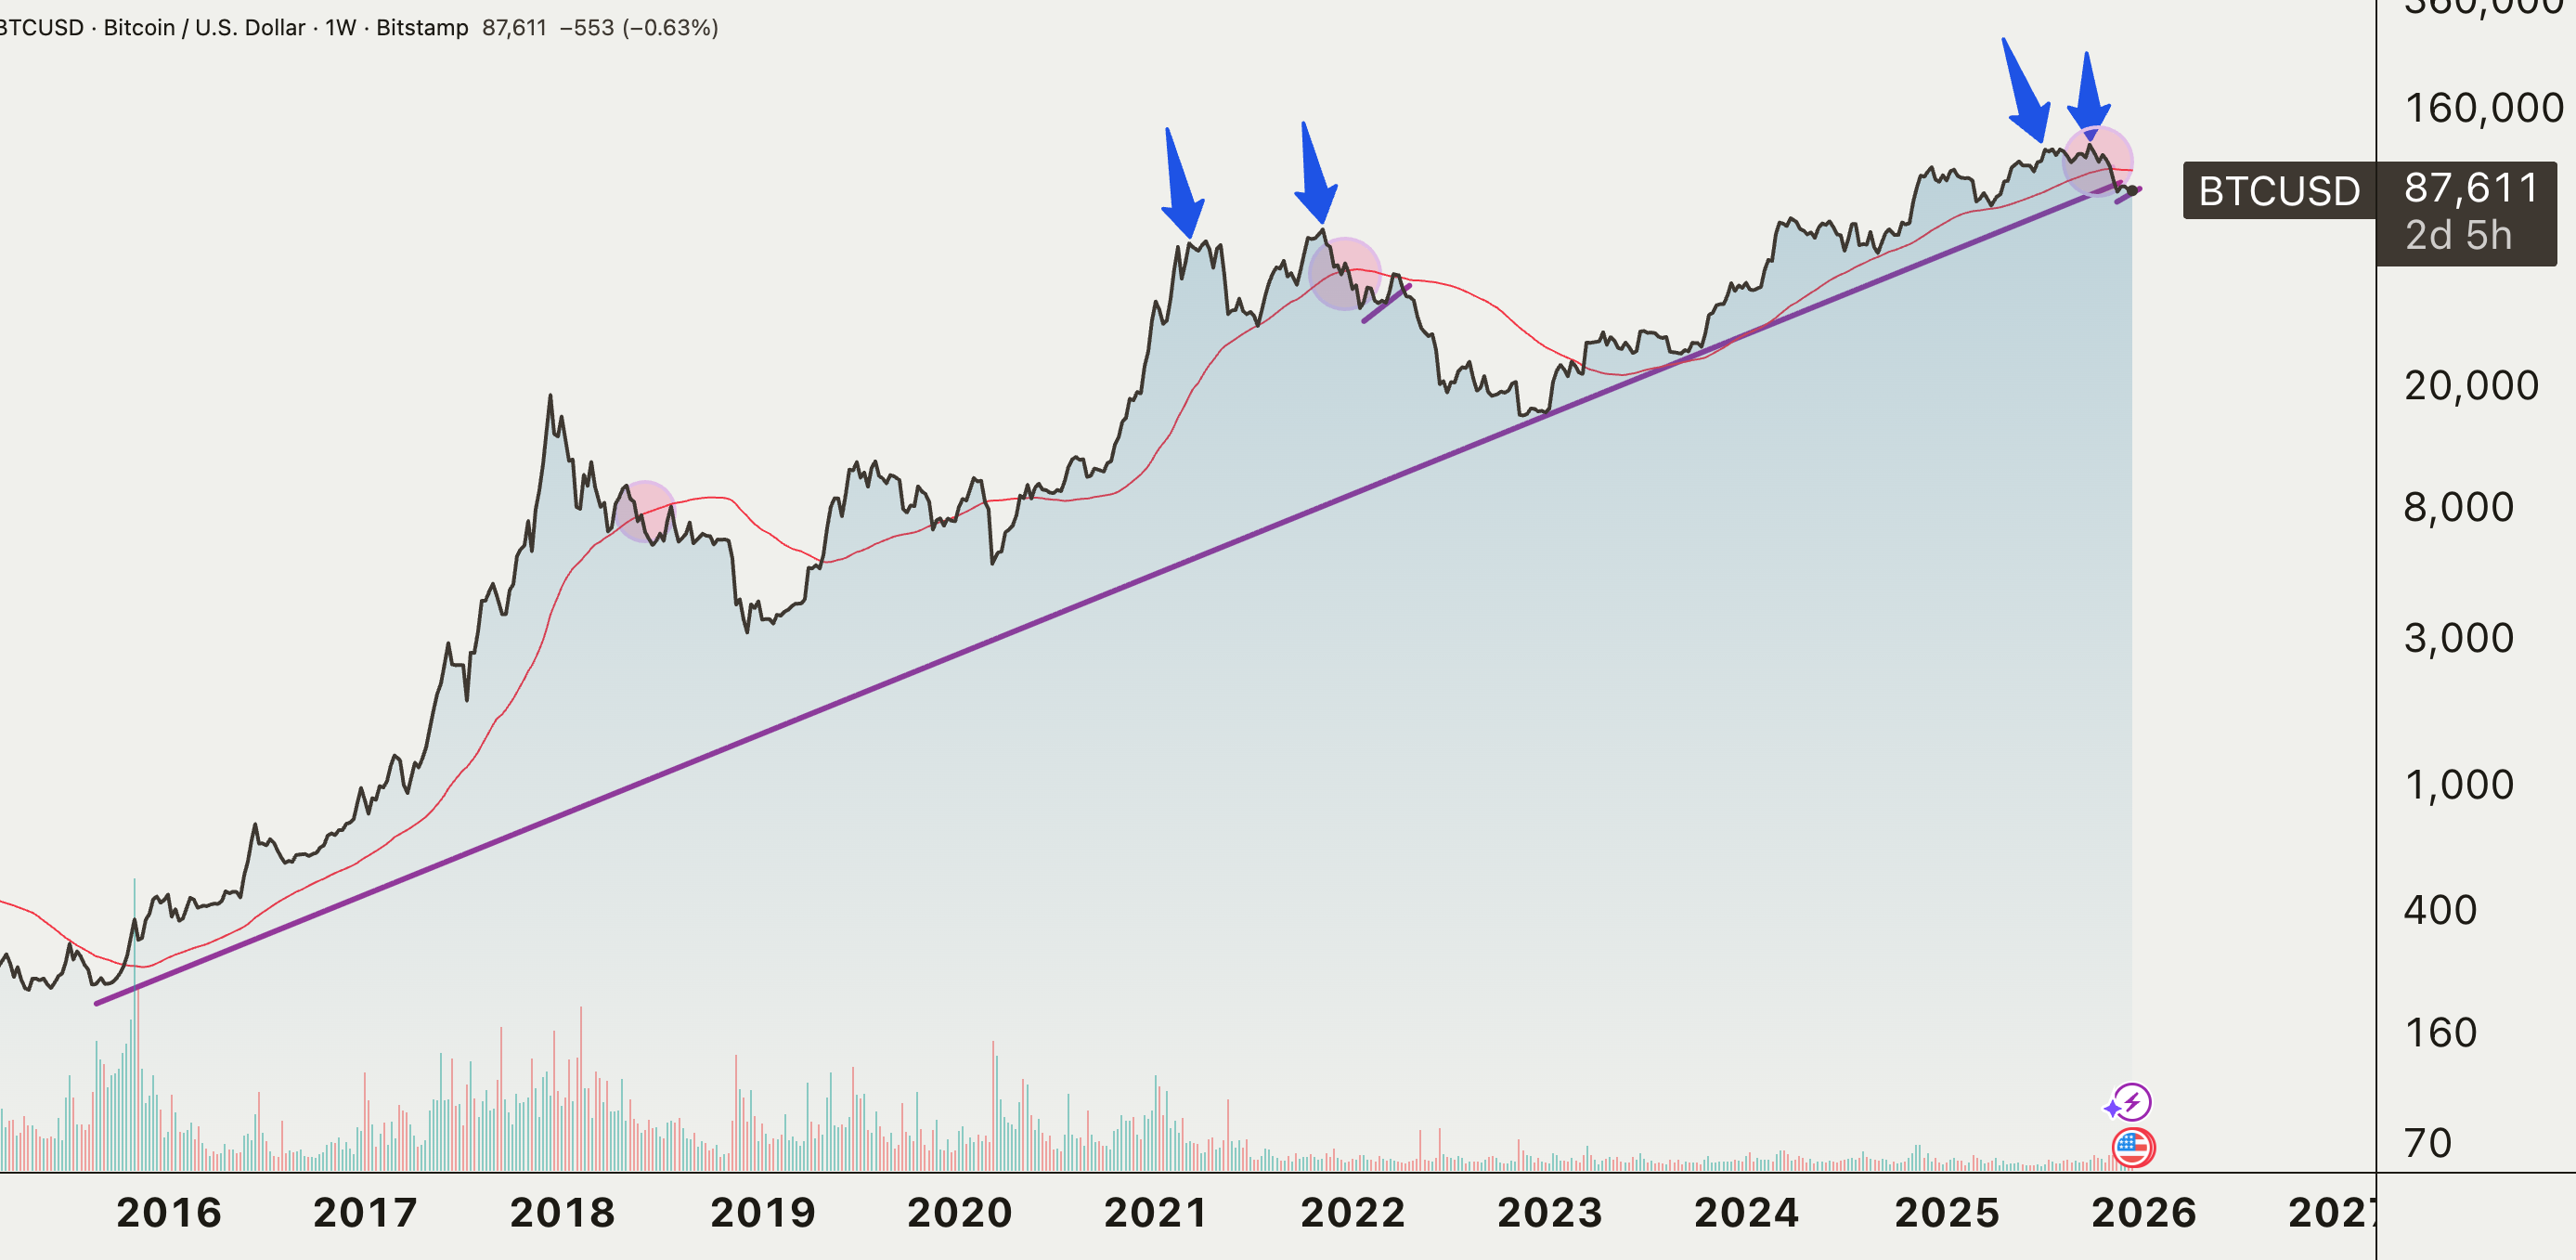
The Critical Floor: 81k seems to be the “line in the sand.” This level aligns with a major 10-year trendline. A decisive weekly close below this could trigger a “liquidation cascade,” potentially exposing the $75,000–$65,000 zone. Let’s also pay attention to the 50 daily moving average, every-time this gets broken, Bitcoin falls to much lower levels.
Failed Recoveries: Recent attempts to bounce have been characterized by “thin liquidity” and “aggressive wicks,” meaning price jumps are quickly sold off by traders de-risking before the year-end.
Counter-Trend Signals: Despite the gloom, the Bank of Japan’s recent rate hike to 0.75% saw a surprise “priced-in” reaction, providing a brief relief bounce back toward $88,000 as the global macro cycle continues to expand. We spoke about Bank of Japan this week also and pointed that a market was already pricing in a rate hike.
2. The “ETF Proxy” & Institutional Shift
